

This post is the first in a series of “Research Highlights” where we discuss select data and research from the literature in the context of community mask making efforts. In this post, we take a look at the filtration and breathability data for nonwoven polypropylene (NWPP) mask materials presented in:
- Long KD, Woodburn EV, Berg IC, Chen V, Scott WS (October 13, 2020) Measurement of filtration efficiencies of healthcare and consumer materials using modified respirator fit tester setup. PLoS ONE 15(10): e0240499. https://doi.org/10.1371/journal.pone.0240499
MakerMask was cited in a recent paper (Long et al, October 2020)! They compared particle filtration efficiency and breathability of mask material combinations and found that three layers of NWPP performed well on both. Here’s our Quick Take on the Methods and Results:
Relevant Results:
Multi-Layer Material Combinations
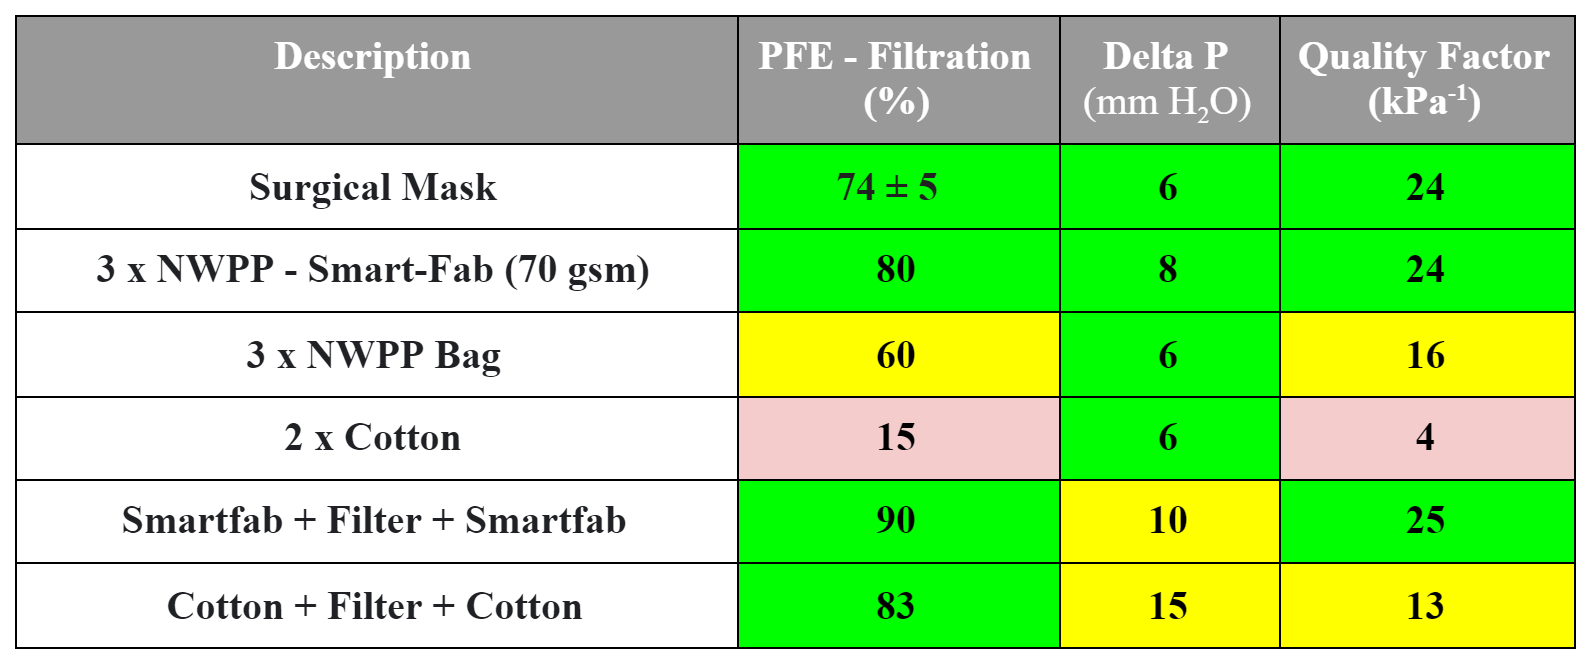
Long et al, (October 2020) show that mask samples constructed from 3-layers of consumer-grade spunbond NWPP (70 gsm, Smartfab) exceeded WHO requirements for fabric masks with a PFE of 80% and breathability of 7.62 mm H2O. More generally, particle filtration efficiency was higher in all of the tested NWPP samples than the cotton samples. We summarize some of the relevant results for multilayer combinations in the table below (Note: MakerMask added the Quality Factor Column, which is a quantitative measure of the balance of filtration and breathability, where higher numbers correspond to better overall performance).
| Description | PFE – Filtration (%) | Delta P (mm H2O) | Quality Factor (kPa-1) |
| Surgical Mask | 74 ± 5 | 6 | 24 |
| 3 x NWPP – Smart-Fab (70 gsm) | 80 | 8 | 24 |
| 3 x NWPP Bag | 60 | 6 | 16 |
| 2 x Cotton | 15 | 6 | 4 |
| Smartfab + Filter + Smartfab | 90 | 10 | 25 |
| Cotton + Filter + Cotton | 83 | 15 | 13 |
In addition to evaluating two and three layer mask material combinations (described above), they also tested the particle filtration efficiency (PFE) of single layers materials. Although the cotton materials they sourced are not described in sufficient detail to be easily source-able from fabric stores, two of the NWPP materials they tested are:
- ~70 gsm Smartfab: PFE of 49 ± 4 % (n=3)
- ~40 gsm Pellon 915: with a PFE of 42 ± 3 % (n=3)
Data Details:
Table 2. Data compiled from primary paper and data published in the supplemental materials, table adapted from Long et al, 2020 by MakerMask
| Sample | Description | # Layers | PFE – Filtration (%) | Delta P (mm H2O) |
| Goal: >70% | Goal: < 35 mm H2O | |||
| Surgical Mask | Surgical Mask
(Hospital standard issue) |
– | 74 ± 5 (n=3) | 6.35 |
| Fabric – Filter – Fabric | Smartfab + Filter + Smartfab | 3 | 90 (n=1) | 10.16 |
| Cotton + Filter + Cotton | 3 | 83 (n=1) | 15 | |
| Nonwoven Polypropylene (NWPP) | 70 gsm NWPP Smart-Fab
(Black; 1U67482420) |
3 | 80 (n=1) | 7.62 |
| 1 | 49 ± 4 (n=3) | 12.7 | ||
| NWPP Bag (Source: Local Library) | 3 | 60 (n=2) | 6.35 | |
| 1 | 38 ±2 (n=3) | 10.16 | ||
| 40 gsm Interfacing (Pellon 915) | 1 | 42 ± 3 (n=3) | 2.54 | |
| Cotton Blend | Pillowcase (Allersoft dust mite barrier) | 1 | 37±4 (n=3) | 12.7 |
| Cotton | Cotton T-Shirt (Gildan 100% Heavy Cotton) | 1 | 36±5 (n=3) | 12.7 |
| Novelty 100% cotton fabric | 1 | 28±3 (n=3) | 6.35 | |
| 2 | 15 (n=2) | 6.35 | ||
| Control | No Material | 2 ± 2 (n=3) | – |
Methods:
Upside: NaCl aerosol testing to evaluate PFE and breathability, which is one of the two methods suggested by the WHO (2020) for fabric masks. They adapted the standard procedure for NIOSH N95 particle testing (TEB-APR-STP-0059) that uses very expensive equipment for particle counting (TSI 8130A, ~$80,000) to a less expensive particle counter (TSI 8038, ~$8,000) making the methodology more approachable for hospitals and some emergency response agencies, but still not approachable for home users.
Downside: The downside to using the less expensive Portacount particle counter is that these commonly suffer from large variations in “ambient” particle counts that make the results less reliable than those collected with the more expensive methods. Given the known variability with this testing method, it would have been nice to see larger number samples (N) of each material type, so that we could assess how repeatable the results/finding are. With a maximum N of 3, there is still a lot of uncertainty/variability. However, it is still far superior to home DIY testing and can help provide insight into the materials available.

2 thoughts on “Research Highlights: NWPP Filtration Efficiency from Long et al 2020”
Comments are closed.